

August's Beaumont numbers are in, and the headline is a sales decline: 43 single-family homes sold, down 15.7% from August 2025. Year-to-date sales have now slipped slightly below last year's pace for the first time in 2026. But sales volume is only part of the story, and the more useful finding is about which homes are trading.
August at a Glance
Sales: 43 homes sold, down 15.69% year-over-year. Year-to-date sits at 306 against 309 last year — down 0.97%, essentially flat but no longer ahead.
New listings: 79 in August, up 3.95%. Notably, that's a much slower increase than earlier in the year; year-to-date listings are still up 14.80% at 675 versus 588.
Average sale price: $543K, down 0.55% from last August. Year-to-date, $561K, up 0.80%.
Average asking price: $588K, down 0.42%. Year-to-date $607K, up 1.60%.
Days on market: 60 days, up 27.66% year-over-year — but down from July's 72. Year-to-date sits at 74 days versus 45 last year.
Ask-to-sell ratio: 0.979, down 0.96%. That's the lowest monthly figure I've recorded this year, after 0.986 in June and 0.982 in July.
Where the Market Actually Shifted
When I sorted every Beaumont single-family sale from January through August by price range and compared it against the same stretch of 2025, one band stood out.
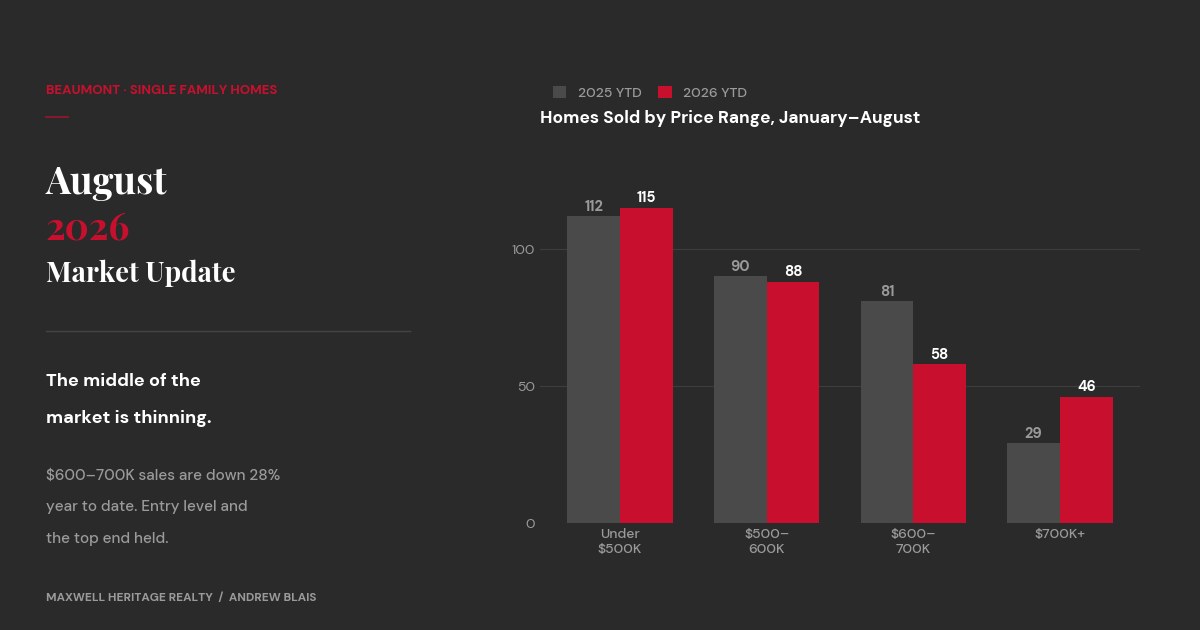
Sales under $500,000 held steady: 115 this year against 112 last year. The $500,000–600,000 range was equally flat at 88 versus 90. Above $700,000, sales actually rose, from 29 to 46 — though those are small enough numbers that I'd treat the size of that jump cautiously.
The $600,000–700,000 band is where the change happened. Eighty-one homes sold in that range through August last year. This year, 58. That's a 28% decline in a segment where the rest of the market held its ground.
In the July update I said homes above roughly $600K were taking longer to find buyers. Looking at eight months of data rather than one, that was too broad. The slowdown is specific to the $600–700K band, not the whole upper market — the top end has been fine. If your home falls in that middle-upper range, that's the pressure point worth planning around.
Values Versus Volume
Fewer sales does not mean falling values, and the per-square-foot numbers continue to suggest values are holding. Across August sales in my records, the median worked out to roughly $299 per square foot, against about $301 last August. Median home size sold was nearly identical both years, around 1,710 square feet, as was the median year built.
The same caution applies as last month: this is one month of roughly 40 sales, and price per square foot ignores lot size, condition, finishes and location. It's a signal, not a measurement. But two consecutive months of flat per-square-foot figures alongside a shifting sales mix points the same direction — what's changing in Beaumont is the pace and composition of sales, not the underlying value of homes.
One footnote on the data: sales get reported to the board with a lag, so recent months fill in over time. July's count in my own records has risen since I wrote about it last month, and August's will likely do the same. It's a reminder to treat the most recent month as provisional.
What This Means If You're Selling
The ask-to-sell ratio has dropped every month since June, and at 0.979 buyers are negotiating harder than at any point this year. Sixty days on market is an improvement on July, but still well above the 45-day pace of 2025.
If your home sits in the $600–700K range, price it with real care. That's where the buyer pool has thinned most, and the homes moving in that band are the ones priced correctly on day one rather than the ones testing the market. Below $500K, activity has been steady all year — that end of the market is still working.
I wrote more about strategy in this post on selling in the current market.
What This Means If You're Buying
The $600–700K range is where you have the most leverage right now — fewer competing buyers, more selection, and sellers who have watched their listing sit. Below $500K it's busier, though nowhere near the competition of last summer.
The slowdown in new listings is worth watching too. August's 3.95% increase is a marked deceleration from earlier in the year, and if that continues into the fall, the inventory advantage buyers have enjoyed all year may narrow.
The Bottom Line
Beaumont's market is cooling in volume rather than in value. Sales are down, days on market are up year-over-year, and buyers have more negotiating room than they've had all year. Underneath that, per-square-foot prices have held steady, and the entry-level market has been consistently active. The real shift is in the middle-upper band, where sales have dropped 28% and sellers should plan accordingly.
Wondering what your specific home is worth in today's market rather than the citywide average? Get a free market evaluation or get in touch and I'll walk you through the comparables that actually apply to your street.
Andrew Blais | MaxWell Heritage Realty
andrew@maxwellheritage.com | 780-387-1284
Headline figures from the REALTORS® Association of Edmonton, August 2026. Price-range and per-square-foot analysis from individual MLS® sale records.
Posted by Andrew Blais onEnjoy this blog post? Click here to subscribe for updates
Leave A Comment